When Bitcoin tumbled to a four-month low near $62,000 during thin weekend liquidity—triggering $2.02 billion in global derivatives liquidations within 24 hours—speculation quickly spread that Binance had dumped proprietary reserves to plug losses from its late-October security breach. On November 15, Binance co-founder Changpeng Zhao publicly refuted rumors that the exchange sold any crypto assets, noting he had personally deployed stablecoins to buy into the dip as Bitcoin stabilized near $64,981.
Cross-referencing exchange-level spot execution metrics with institutional fund flows tells a markedly different story from social-media conjecture. Rather than an offshore exchange liquidation, the five-week downdraft reflects sustained U.S.-session spot selling, seven consecutive days of spot Bitcoin ETF redemptions, a 5.14% U.S. 10-year Treasury yield ceiling, and pre-IPO liquidity crowding ahead of major Wall Street capital-market events.
Dissecting the Binance Dump Rumor Against Spot Orderbook Evidence
Market suspicion toward Binance stemmed from the proximity of its record October breach, visible movements out of its emergency insurance wallet, and the concentration of forced derivatives liquidations on high-volume venues.
The $6.34 Billion Breach, 7,500 BTC SAFU Movement, and OTC Rebalancing
According to TRM Labs and security disclosures, attackers compromised a wallet-signing service on October 29 and swept between $6.34 billion and $6.36 billion across ten blockchains in roughly 20 minutes—an exploit the FBI attributed to North Korea's TraderTraitor group, also tracked as Lazarus. Stablecoin issuers and partners froze roughly $3 billion on-chain, including $1.57 billion by Tether and over $800 million by Circle, while the U.S. Department of Justice announced court-authorized seizure and restraint orders covering more than $1.2 billion on November 12.
After pausing withdrawals for roughly 56 hours and restoring about 98% of affected customer balances from internal reserves by November 2, on-chain trackers observed roughly 7,500 BTC—worth approximately $580 million, or half of Binance's $1 billion Secure Asset Fund for Users (SAFU)—moving to unlabeled addresses on October 31 and November 3. In institutional treasury operations, however, fragmenting Bitcoin transfers to external settlement desks typically reflects off-exchange over-the-counter (OTC) swaps to replenish drained altcoin and stablecoin inventories without hitting public spot books, echoing Bybit's February 2025 recovery from its $1.5 billion Ether breach via partner bridge loans and OTC sourcing rather than open-market disruption.
Anchorage Digital Spot CVD Metrics and $1.91 Billion in U.S. ETF Redemptions
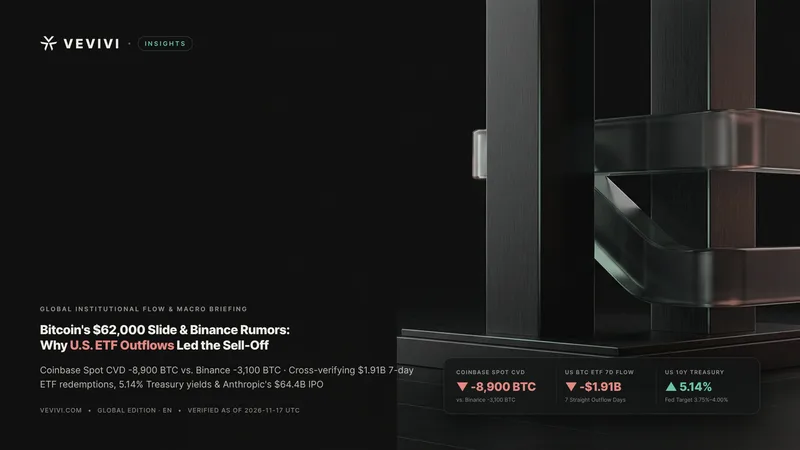
Orderbook execution data compiled by Anchorage Digital Head of Research David Lawant pinpoints the primary origin of aggressive spot selling squarely in the United States. Between November 9 and November 14 UTC, Cumulative Volume Delta (CVD) across flagship spot Bitcoin pairs plunged to minus 8,900 BTC on Coinbase—nearly triple Binance's minus 3,100 BTC and far exceeding Bybit's minus 700 BTC—whereas Asia-focused OKX recorded net active buying of plus 1,400 BTC.
Data from The Block and CoinGlass further confirms that U.S. spot Bitcoin ETFs bled $1.91 billion across seven straight trading sessions through Friday, pushing 2026 net year-to-date flows to roughly minus $1.56 billion as BlackRock's IBIT closed November 16 down 5.52% at $36.79 and Coinbase shares fell 6.11% to $119.84. Once cumulative weekday ETF redemptions pushed Bitcoin beneath its 200-day moving average, weekend orderbooks lacking U.S. institutional market-maker depth absorbed $1.68 billion in long liquidations out of $2.02 billion total forced closures.
Structural Trust Deficits and Evolving Exchange Market Structure
Even when U.S. spot venues lead net selling, traders reflexively scrutinize centralized offshore exchanges due to historical collateral-pricing failures, shifting liquidity share, and heightened political visibility.
Lessons From the October 2025 USDe Depeg and Spot Share Compression to 42%
Institutional wariness traces back to the October 10, 2025 flash crash, which wiped out $19.3 billion in leveraged positions across global crypto markets. As documented by Galaxy Research, Ethena's synthetic dollar USDe briefly plunged to $0.65 exclusively on Binance while holding near $1.00 on decentralized venues because margin collateral was marked against internal orderbook prints rather than composite external price feeds, triggering a self-reinforcing auto-deleveraging loop.
Combined with lingering memories of February's weekend sell-off rumors and the October security breach, counterparty diversification has accelerated across institutional desks. Kaiko market-share data shows Binance's share of spot volume among the top ten centralized exchanges slipped from 48% to 42% in the week following withdrawal resumption, while OKX expanded from 11% to 14% and Coinbase rose to 9.6%, alongside structural migration toward verifiable on-chain perpetual protocols such as Hyperliquid as centralized orderbook depth thins.
Post-FTX Contagion Sensitivity, USD1 Concentration, and Regulatory Scrutiny
Zhao's rapid public intervention reflects acute awareness of the November 2022 FTX collapse, where unaddressed rumors of exchange-led token liquidation morphed into an irreversible solvency run within days. Allowing a narrative to take hold that an exchange is trading against its own users risks prompting institutional liquidity providers to widen spreads and pull collateral regardless of underlying reserve ratios.
Governance stakes in Washington amplify that sensitivity following the November 3 U.S. midterm elections, which handed Democrats control of Congress starting January 2027. Forbes reporting indicates Binance holds roughly 87%—nearly $4.7 billion—of the circulating supply of USD1, the dollar stablecoin issued by World Liberty Financial, while incoming Senate Permanent Subcommittee on Investigations leadership has already requested compliance records from Binance, Tether, and World Liberty Financial ahead of the new legislative session.
Wall Street Macro Headwinds: Rate Hikes, AI De-Risking, and Underwater Cohorts
Bitcoin's inability to sustain a rebound even after Binance deposits turned net positive underscores that the dominant downward force sits outside crypto-native plumbing in U.S. rates and cross-asset equity positioning.
The Fed's Hike to 3.75%–4.00%, 5.14% Yields, and the Nasdaq-100 Margin Shock
Macro tightening returned to center stage on September 16, 2026, when the Federal Open Market Committee raised the federal funds target range by 25 basis points to 3.75%–4.00%, its first rate hike since 2023. Subsequent Bureau of Labor Statistics data showing October headline CPI rising 0.4% month-over-month kept the U.S. 10-year Treasury yield anchored at 5.14% on November 17, compressing valuation multiples across non-yielding alternative assets.
Cross-asset contagion intensified on November 5—two days after the U.S. midterms—when concerns over state-level data-center power restrictions and artificial-intelligence capital intensity sent the Nasdaq-100 down 6.4% in a single session, its steepest daily drop since March 2020. Echoing institutional warnings from Hilbert Group Chief Investment Officer Russell Thompson, multi-asset funds confronting equity margin calls systematically liquidated liquid non-core holdings held in the same brokerage accounts, turning spot Bitcoin ETFs into a primary source of dry powder.
Unrealized Losses Across ETF Buyers, Short-Term Holders, and Strategy
Trading near $64,981 places three major U.S.-aligned capital cohorts simultaneously underwater, creating overhead supply on relief rallies. Brokerage flow estimates place the average cost basis of U.S. spot Bitcoin ETF holders near $83,000, while on-chain short-term holders who accumulated within the past five months sit near an average realized basis of roughly $75,000.
Corporate treasury positioning faces parallel index pressure around that same $75,000 cost zone. Strategy (MSTR), which holds 850,364 BTC and saw its shares drop 7.70% to $103.03 on November 16, is scheduled for removal from MSCI global and U.S. equity benchmarks at the November 30 market close—a rebalancing event projected to force between $2 billion and $3 billion in passive index-fund share sales.
Late-November Liquidity Calendar and Conditional Market Scenarios
Over the next three weeks, an unprecedented AI public offering, inflation data, index rebalancing, and the final policy meeting of the year will test whether weekend capitulation marked a local exhaustion point.
Anthropic's $64.4 Billion IPO, October PCE Inflation, and the December FOMC
Immediate capital-market attention centers on Anthropic's Nasdaq Global Select Market debut under ticker ANT on Thursday, November 19, following final pricing on November 18. Per its amended SEC Form S-1 registration statement, Anthropic is marketing 825 million Class A shares at $70.00 to $78.00 per share—raising up to $64.35 billion to $64.4 billion publicly alongside a $26.0 billion private placement led by Google and Nvidia at a fully diluted valuation up to $1.4 trillion—temporarily draining institutional risk budgets.
Macro catalysts follow in rapid succession: the Bureau of Economic Analysis releases October Personal Consumption Expenditures (PCE) inflation at 8:30 a.m. ET on November 25, MSCI executes Strategy's index deletion on November 30, and the Federal Reserve convenes on December 8–9. With major Wall Street desks warning of further tightening if core services inflation stays sticky, rate volatility remains the primary macro gatekeeper.
Post-IPO Liquidity Rotation Versus a Realized-Price Stress Test
In a constructive stabilization scenario, pre-IPO cash hoarding reverses once Anthropic's allocation settles—mirroring the liquidity rotation that lifted Bitcoin sharply after SpaceX completed its landmark Nasdaq listing under ticker SPCX in June 2026—especially if partial day-one employee share unlocks temper speculative momentum chasing in tech equities. Coupled with an in-line October PCE print pulling 10-year Treasury yields below 5.0% and positive Coinbase spot CVD, Bitcoin could attempt to reclaim structural resistance near $73,000.
Conversely, if November 25 PCE data surprises to the upside and cements December rate-hike expectations while passive MSTR outflows spill into broader crypto sentiment at month-end, downside momentum could retest deeper institutional support bands. Analysts at Standard Chartered previously highlighted $59,000 as a cycle floor zone, while 10x Research and on-chain valuation models point to $55,000–$57,000 near Bitcoin's network-wide realized price as the ultimate structural defense line.
Key Institutional Questions on Exchange Flows and Macro Catalysts
Below is a concise breakdown of the primary market-structure questions surrounding the weekend drawdown and the metrics signaling genuine stabilization.
Did Binance sell Bitcoin on spot orderbooks to cover its October hack losses?
Available on-chain and exchange execution records show no verified evidence that Binance dumped proprietary Bitcoin onto public spot books. The 7,500 BTC transferred from its SAFU wallet to unlabeled addresses aligns with standard OTC cross-asset rebalancing to restore non-BTC token balances, whereas Anchorage Digital's November 9–14 spot CVD shows Coinbase net selling (-8,900 BTC) was nearly 2.9 times larger than Binance's (-3,100 BTC).
Why did Bitcoin break down over the weekend while U.S. spot ETFs were closed?
Seven consecutive days of U.S. spot ETF outflows totaling $1.91 billion weakened market-maker inventory buffers and pushed Bitcoin below its 200-day moving average during regular U.S. trading hours. When aggressive spot selling persisted into thin weekend orderbooks without U.S. authorized-participant arbitrage depth, cascading derivatives liquidations wiped out $1.68 billion in leveraged longs within 24 hours.
Which indicators will confirm whether forced institutional selling has exhausted?
Confirming a durable floor requires tracking three lagging and coincident benchmarks simultaneously: Coinbase spot CVD transitioning from deeply negative territory back to net accumulation, daily U.S. spot Bitcoin ETF flows halting their multi-day redemption streak, and the U.S. 10-year Treasury yield retreating from 5.14% following the November 25 October PCE release.
Disclaimer and Risk Warning
This article is provided strictly for informational and educational purposes based on publicly available on-chain metrics and macroeconomic data. Nothing in this publication constitutes financial, investment, legal, or tax advice, nor should it be construed as a solicitation, recommendation, or offer to buy or sell any digital asset or financial instrument. Digital assets are subject to high market risk and extreme price volatility, and you may lose part or all of your invested capital. Historical market cycles and past performance referenced herein do not guarantee future results. You are solely responsible for your own investment decisions and should conduct independent research and consult a qualified financial advisor before making any financial commitments.