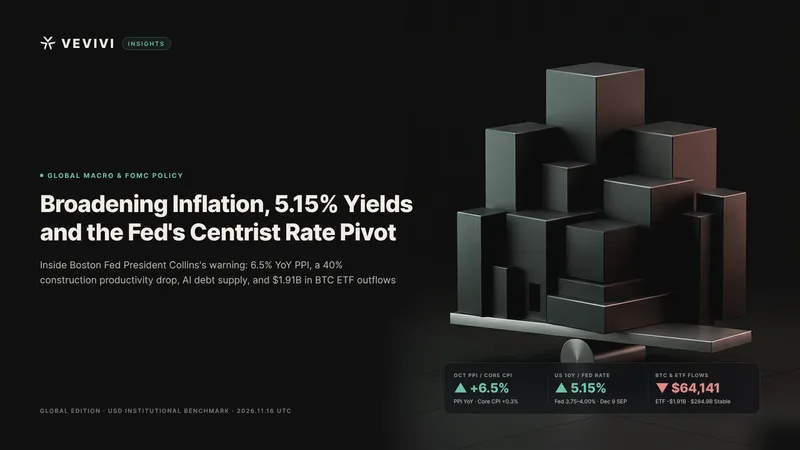
Federal Reserve Bank of Boston President Susan M. Collins has reinforced a pivotal shift across the central bank's centrist core, signaling at the Bank's 70th Economic Conference and in subsequent policy remarks that additional monetary tightening is warranted. Although the U.S. Bureau of Labor Statistics (BLS) reported that October 2026 headline Producer Price Index (PPI) final demand rose 0.3% month over month—slightly below the 0.4% consensus—annual producer inflation accelerated to 6.5% year over year, the steepest 12-month climb since November 2022 (7.4%). With U.S. inflation running above the Federal Reserve's 2% target for more than five years, even measured policymakers now acknowledge that the trajectory for policy rates over the coming year will likely sit higher than penciled in just two months ago.
For global institutional desks, the pressure extends well beyond the short-term federal funds target range of 3.75% to 4.00% maintained at the October 28 Federal Open Market Committee (FOMC) meeting. Benchmark U.S. 10-year Treasury yields have climbed back to 5.15%, tightening financial conditions across duration-sensitive assets and pulling Bitcoin (BTC) to $64,141—roughly 49% below its cycle all-time high above $126,000. Understanding why the Fed cannot prematurely ease policy requires examining three structural forces highlighted by Boston Fed research and live market data: demand-led inflation broadening beyond energy, a 40% multi-decade collapse in U.S. construction productivity, and artificial intelligence (AI) debt issuance pushing long-end term premiums higher.
Price Pressures Broaden Beyond Energy Across Goods and Services
A recurring critique among market doves argues that the late-2026 inflation rebound merely reflects an external energy shock feeding into freight and grocery bills. Granular October 2026 BLS releases refute that narrow reading, demonstrating that price increases have spread across non-energy manufacturing inputs, core services, and consumer discretionary categories. Headline Consumer Price Index (CPI-U) inflation rose 0.4% month over month in October, while core CPI excluding food and energy advanced 0.3% for the third consecutive month across August, September, and October.
Wholesale Pipeline Momentum Overrides Energy Softness
Underlying wholesale data confirm that pipeline pressures are no longer reliant on crude oil spikes. Even as the October PPI final demand energy index edged down 0.1% on the month, final demand goods rose 0.5% month over month and surged 10.2% over the past 12 months, driven by core goods excluding food and energy (+0.5% monthly). Core PPI excluding foods, energy, and trade services also climbed 0.5% month over month and 4.9% year over year, while final demand services rose 0.2% for a fifth straight monthly advance behind a 3.9% jump in truck freight rates and rising outpatient hospital costs. Within consumer prices, shelter rose 0.3%—accounting for over 30% of the monthly headline CPI gain—alongside broad increases in medical care (+0.3%), motor vehicle insurance (+0.7%), recreation (+0.8%), and food away from home (+0.5%).
Corporate Margin Pass-Through and Tight Regional Labor Pockets
Field intelligence gathered from First District chief executives across New England corroborates the national data. Businesses in Vermont and neighboring states report mounting margin compression from employee health insurance premiums, logistics, and intermediate inputs, with executives planning to pass a meaningful share of those costs onto consumers despite growing price sensitivity outside luxury segments. While smaller enterprises face tighter operating buffers than large-cap peers, aggregate household consumption and AI-linked capital expenditure remain resilient enough to keep demand running ahead of supply capacity. Nationally, U.S. nonfarm payrolls added 165,000 jobs in October with unemployment steady at 4.1%, while state-level BLS Local Area Unemployment Statistics (LAUS) show unemployment in pockets like Vermont sitting at just 2.6%, sustaining wage floors across skilled trades and service industries.
The December SEP Dot Plot: Gradual Tightening Versus Front-Loaded Hawks
With price pressures broadening alongside a stable labor market, focus now turns to the December 8–9, 2026 FOMC meeting and its updated Summary of Economic Projections (SEP). Following a 25-basis-point hike in September, the Committee voted 10–2 on October 28 to hold the federal funds target at 3.75%–4.00%, with Governor Lisa Cook and Cleveland Fed President Beth Hammack dissenting in favor of an immediate quarter-point increase. Subsequent inflation prints have shifted the internal debate from whether to tighten further to how fast and how high the terminal rate must move.
Anchored Inflation Expectations Temper 50-Basis-Point Tail Bets
Inside the Committee, hawkish voices have floated steeper or faster options: Governor Christopher Waller outlined scenarios in which falling behind inflation could force discussion of a 50-basis-point move in December, while Dallas Fed President Lorie Logan advocated at least two additional quarter-point hikes, potentially pulling a second increase forward from March to January 2027. Collins staked out a disciplined middle ground, favoring a steady, meeting-by-meeting pace of adjustment rather than pre-committing to oversized steps. Crucially, her benchmark for ruling out emergency 50-basis-point tightening is that medium- and longer-term inflation expectations remain firmly anchored near 2%—though she emphasized that any sign of unanchoring would trigger a more aggressive policy response.
FOMC Voting Rotation and Centrist Consensus Signaling
Institutional rates desks also weigh the mechanics of FOMC governance. Under the Federal Reserve's annual reserve-bank rotation, Collins serves as a non-voting participant in 2026, becomes an alternate member in 2027, and rotates back into a formal voting seat in 2028. Even without casting a December ballot, every Reserve Bank president submits rate projections to the quarterly SEP dot plot and shapes deliberations around the table. When a pragmatic centrist signals that policy rates over the next year may need to climb higher than previously projected while balancing two-sided real-economy risks, it indicates that the median 2027 SEP dot is poised to migrate upward in December.
The 40% Construction Productivity Gap and the Housing Rate Paradox
Nowhere is the friction between inflation control and real-economy strain sharper than in residential real estate—the centerpiece of the Boston Fed's 70th Economic Conference. Historically, housing exerts outsized macroeconomic leverage: Collins noted in her opening remarks that residential activity generated roughly 17% of U.S. GDP growth during the 2001:Q4–2005:Q3 expansion and accounted for approximately 41% of the total output contraction during the 2007:Q4–2009:Q2 downturn. Near-term rate hikes undeniably raise builder financing costs and lock existing homeowners into legacy mortgages.
Yet research presented at the conference by University of Chicago Booth economist Chad Syverson underscores why monetary easing is no silver bullet for housing affordability. Whereas labor productivity across the broader U.S. economy expanded substantially over the past half-century, the construction sector produced roughly 40% less output from an equivalent set of inputs in 2020 than it did in 1970, with efficiency eroding further after the pandemic. Compounded by restrictive municipal zoning, permitting delays, and an aging Northeast housing stock, supply inelasticity cannot be fixed by central bank liquidity. Because shelter represents roughly one-third of the CPI basket, pausing rate hikes prematurely while general inflation exceeds 2% would destabilize long-term inflation expectations and push 30-year mortgage benchmarks even higher. Restoring predictable 2% price stability remains the prerequisite for sustainable housing finance.
AI Debt Financing, the 5.15% 10-Year Yield, and Digital Asset Liquidity
The final macro transmission channel runs directly from corporate AI capital expenditure into sovereign bond yields and digital asset liquidity. Contrary to widespread fears of immediate mass labor displacement, First District firms report deploying AI primarily as a complement to existing staff—expanding output capacity to overcome skill bottlenecks rather than slashing headcount. However, financing hyperscale data centers, power grids, and semiconductor buildouts has unleashed a wave of corporate debt issuance and credit commitments that is lifting medium- and long-term borrowing costs independently of short-end FOMC policy.
While the policy-sensitive U.S. 2-year Treasury yield trades at 4.86%, the benchmark 10-year Treasury yield stands at 5.15% (with the 30-year yield at 5.47%), holding above the psychological 5% threshold after touching a 52-week peak of 5.31% in early October. Collins confirmed that AI-related borrowing and capital financing structures are actively influencing medium- and longer-term interest rates, even as overall financial market plumbing continues to function smoothly without acute systemic stress.
For global crypto portfolios, a macro regime combining upward December SEP dot revisions with a 5.15% risk-free 10-year Treasury yield imposes a steep opportunity cost on non-yielding duration assets. As of November 16, 2026 (UTC), Bitcoin trades at $64,141 and Ethereum (ETH) at $1,796 alongside the S&P 500 at 7,561.67. Across the 12 U.S. spot Bitcoin exchange-traded funds (ETFs), institutional redemptions reached $1.91 billion over seven consecutive trading days ($1.07 billion last week and $2.35 billion across two weeks), flipping 2026 year-to-date net flows negative to -$1.98 billion while BlackRock's IBIT holds $53.99 billion in net assets. U.S. spot Ether ETFs similarly logged a seventh straight weekly outflow (-$398.9 million weekly, -$2.42 billion over seven weeks). Meanwhile, global stablecoin supply—the crypto market's sidelined dry powder—contracted 1.43% over seven days to $284.91 billion on DefiLlama (led by USDT at $175.32 billion or 61.54% dominance, and USDC at $69.32 billion, with DeFi TVL at $71.08 billion). Because stablecoin capitalization acts as a lagging indicator of dollar funding conditions rather than a leading price trigger, a durable digital asset recovery hinges on post-December FOMC stabilization in 10-year yields below 5.0% and a verified halt to spot ETF redemptions.
Institutional Investor FAQ on Fed Policy and Crypto Liquidity
Why are Fed officials signaling rate hikes when October headline PPI came in below expectations?
Although October headline final demand PPI rose 0.3% month over month versus a 0.4% consensus forecast, the 12-month rate climbed to 6.5%—the highest since November 2022—and core PPI excluding foods, energy, and trade rose 0.5% on the month. Combined with a third consecutive 0.3% monthly gain in core CPI and corporate surveys showing pass-through of health insurance and input costs, policymakers see persistent demand-driven broadening rather than a fading energy blip.
Why does the Federal Reserve resist pausing rate hikes to ease U.S. housing costs?
U.S. housing affordability is constrained by deep structural bottlenecks outside central bank control, including a roughly 40% decline in construction output per unit of input between 1970 and 2020 and local zoning restrictions. Because shelter makes up roughly one-third of CPI, prematurely halting tightening while inflation remains above 2% would unanchor bond market inflation expectations and drive long-term mortgage rates higher rather than lower.
Which macro and on-chain metrics signal a liquidity inflection for Bitcoin?
Institutional desks are tracking three primary catalysts: first, where the median 2027 terminal rate lands in the December 8–9 FOMC SEP dot plot; second, whether U.S. 10-year Treasury yields retreat sustainably from 5.15% below 5.0% as AI corporate debt issuance is absorbed; and third, whether the seven-day, $1.91 billion outflow streak across U.S. spot Bitcoin ETFs and the contraction in $284.91 billion global stablecoin dry powder reverse into net inflows.
Disclaimer and Risk Warning
This article is provided strictly for informational and educational purposes based on publicly available on-chain metrics and macroeconomic data. Nothing in this publication constitutes financial, investment, legal, or tax advice, nor should it be construed as a solicitation, recommendation, or offer to buy or sell any digital asset or financial instrument. Digital assets are subject to high market risk and extreme price volatility, and you may lose part or all of your invested capital. Historical market cycles and past performance referenced herein do not guarantee future results. You are solely responsible for your own investment decisions and should conduct independent research and consult a qualified financial advisor before making any financial commitments.