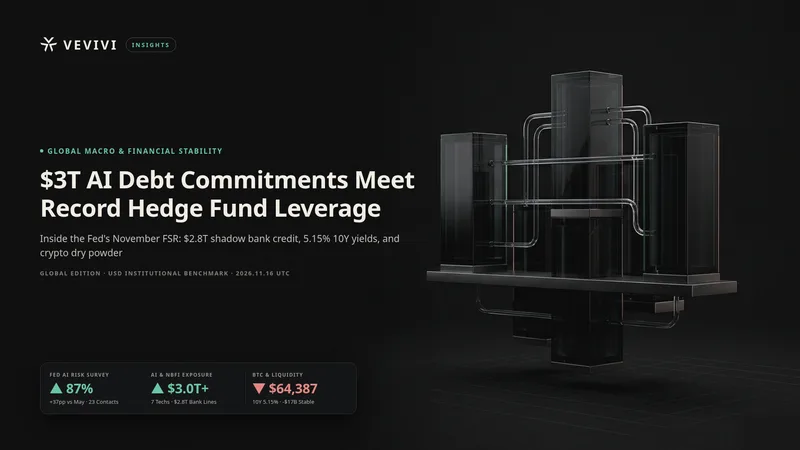
The Federal Reserve Board's November 2026 Financial Stability Report, released on November 13 reflecting market data through October 28, characterizes the regulated U.S. banking system as sound and resilient while raising pointed warnings over leverage accumulating outside traditional bank balance sheets. In the Federal Reserve Bank of New York's Fall 2026 Survey of Salient Risks (Box 5.1), conducted across 23 market contacts in September and October, 87% of respondents cited artificial intelligence (AI) valuation pressures and complex financing structures as a top systemic risk—surging 37 percentage points from 50% in May 2026 and up from 30% in Fall 2025.
For global institutional desks, the decisive shift is not equity narrative fatigue but balance-sheet plumbing. With the Federal Open Market Committee (FOMC) holding the federal funds target range at 3.75% to 4.00% on October 28 (with two governors dissenting in favor of a 25-basis-point hike) and the benchmark 10-year U.S. Treasury yield closing at 5.15% on November 13, record post-2013 hedge fund leverage and roughly $3 trillion in Big Tech infrastructure obligations are competing directly for dollar funding. As of November 16, 2026 at 10:20 UTC, Bitcoin (BTC) trades at $64,386.52 and Ether (ETH) at $1,800.11, reflecting tighter dollar dry powder across global risk assets.
The AI Debt Surge and $3 Trillion in Circular Off-Balance-Sheet Commitments
Whereas early generative AI capital expenditures were funded predominantly out of hyperscaler free cash flow, 2026 marked a decisive pivot toward public debt markets, structured project finance, and private credit. In a dedicated analysis titled Leverage in the Data Center Buildout (Box 2.2), Federal Reserve staff documented that advanced-computing infrastructure has become a primary driver of U.S. investment-grade corporate supply.
$680 Billion in YTD Issuance Captures 31% of Nonfinancial IG Supply
According to Federal Reserve staff estimates covering public offerings and Rule 144A securities, advanced-computing debt issuance topped $680 billion year-to-date through October 2026—more than 5.2 times full-year 2023's $130 billion total. That borrowing surge lifted AI-linked issuance from less than 6% of U.S. nonfinancial investment-grade corporate bond supply in 2023 to roughly 31% in 2026, pushing total outstanding public advanced-computing debt past $1.1 trillion (including more than $150 billion YTD from investment-grade data-center operators). Because Section 4(a)(2) private placements and bilateral private credit loans are excluded from that tally, Fed Vice Chair for Supervision Michelle Bowman noted earlier in November that broader AI-related debt issuance is on pace to exceed $800 billion this year.
Seven Tech Giants Carry $3 Trillion in Combined Debt, Leases, and Chip Guarantees
Examining SEC Form 10-K and Form 10-Q filings across seven foundational technology firms—Amazon, Alphabet, Broadcom, Meta Platforms, Microsoft, Nvidia, and Oracle—the Fed estimates combined on-balance-sheet debt, undiscounted long-term data-center leases, purchase commitments, and guarantees at roughly $3 trillion, including more than $2 trillion in off-balance-sheet obligations. Crucially, the report highlights circular financing arrangements: hyperscalers sign multi-year leases with specialized data-center developers that borrow against those contracts, while GPU suppliers guarantee chip residual values alongside equity stakes in neocloud customers, creating economic downside exposure larger than headline balance-sheet liabilities imply.
Record Post-2013 Hedge Fund Leverage and $2.8 Trillion in Shadow Credit Links
Alongside corporate AI borrowing, Section 3 of the report underscores notable vulnerabilities in nonbank financial intermediation (NBFI). While U.S. commercial banks maintain historically high regulatory capital ratios, structural leverage has migrated into hedge funds, life insurers, and opaque private debt vehicles whose interconnections with regulated banks remain only partially visible.
$13 Trillion Gross Hedge Fund Assets Crowd Into Treasury Basis Trades
Federal Reserve data show gross hedge fund assets expanding from roughly $4 trillion in 2012 to approximately $13 trillion in 2026, driving aggregate hedge fund leverage to its highest level since comprehensive supervisory tracking began in 2013. This leverage is heavily concentrated among the largest multi-strategy funds deploying capital across U.S. Treasury cash-and-carry basis trade books, interest rate derivatives, and mega-cap equities. With swaption-implied interest rate volatility climbing above its long-run median of 81.82 basis points, any spike in repo funding rates or initial margin requirements risks triggering synchronized position unwinds.
$2.8 Trillion in Bank NBFI Credit Lines and Gated BDC Redemptions
Post-crisis ring-fencing has not insulated banks from shadow-banking stress. Bank credit commitments to nonbank financial institutions surpassed $2.8 trillion in the second quarter of 2026, with private equity funds, business development companies (BDCs), and private credit vehicles accounting for roughly one-quarter of that total. Separately, the largest U.S. bank holding companies hold close to $1 trillion in aggregate exposure across major tech firms, data-center developers, advanced-computing special purpose entities (SPEs), private credit funds, and utilities. Within the $2.6 trillion U.S. private credit ecosystem—newly integrated into the Fed's Z.1 Financial Accounts—certain perpetual-life nontraded BDCs continued restricting investor redemptions amid persistent net outflows, while junior debt tranches sit largely with high-yield funds, life insurers, and BDCs.
How 5.15% Treasury Yields and Basis Leverage Transmit Into Crypto Markets
For digital asset allocators, the Fed's findings connect directly to crypto market microstructure through two institutional channels: sovereign duration crowding that drains on-chain dry powder, and cross-asset margin contagion across multi-strategy trading desks.
Rising Term Premiums and a $17 Billion Monthly Stablecoin Supply Contraction
Absorbing more than $680 billion of high-grade AI corporate supply atop a $30.88 trillion U.S. Treasury market (Table 1.1) has pushed nominal 10-year Treasury term premiums well above their post-1998 median of 0.55 percentage points, anchoring 10-year yields at 5.15% against a 3.75%–4.00% policy floor (and 3.90% interest on reserve balances). Risk-free yields above 5% raise the hurdle rate for non-yielding digital assets and incentivize redemptions into government money market funds. Per Glassnode data cited by CoinDesk, major stablecoin capitalization contracted by roughly $17 billion over the past month to approximately $244 billion—down $27 billion from its May 2026 peak within a ~$300 billion multichain stablecoin universe—while total DeFi total value locked (TVL) across 607 chains sits at $71.29 billion per DefiLlama.
Liquidity Valve Dynamics When Cross-Asset Correlations Converge to One
Behind AI risks (87%), New York Fed survey contacts ranked a broad risk-asset correction second at 52% (+17 percentage points vs. May) and higher long-term rates third at 48% (+28 percentage points), followed by cyberattacks (43%) and fiscal debt sustainability (43%). Because top quantitative and macro hedge funds run leveraged Treasury basis trades alongside CME crypto futures arbitrage and spot ETF inventories, rate-driven margin calls force rapid Value-at-Risk (VaR) reductions. When correlations converge toward one during off-hours stress, 24/7 liquid markets such as Bitcoin ($64,386.52) and Ether ($1,800.11) absorb immediate deleveraging alongside Nasdaq Composite pullbacks (25,136.27).
Separating Lagging Survey Sentiment From Actionable Institutional Scenarios
Disciplined allocators must distinguish the New York Fed outreach survey—which reflects external market contacts' views rather than Federal Reserve Board policy—from hard balance-sheet triggers. Sentiment surveys often behave as a lagging indicator after autumn volatility, whereas credit spreads and repo plumbing provide forward signals.
Orderly Hyperscaler Absorption Versus Nonbank Basis Deleveraging
Under an orderly absorption scenario, senior collateralized bank positions—highlighted by both the Fed and the Office of the Comptroller of the Currency (OCC)—and massive hyperscaler operating cash flows cushion localized AI disappointments; cash-rich tech incumbents can acquire distressed developer capacity, capping systemic spillover while stabilizing 10-year yields below 5.15% and reviving stablecoin inflows. Conversely, under a nonbank deleveraging scenario, disappointing AI capital returns colliding with above-5.15% long-end yields could widen corporate bond spreads from historical lows, impair subordinated BDC and insurer tranches, and force hedge fund Treasury basis unwinds. Rather than relying on too-big-to-fail assumptions, institutional desks should track Treasury swaption volatility, high-yield excess bond premiums, and net stablecoin minting before re-leveraging crypto beta.
Frequently Asked Institutional Questions
Does the 87% AI risk reading mean the Federal Reserve will restrict AI lending immediately?
No. Box 5.1 explicitly states that the 23-contact survey reflects market participants' perspectives, not the official stance of the Board of Governors. Rather than imposing direct credit controls, the Fed evaluates large banks' ~$1 trillion tech, SPE, utility, and private credit exposures within its annual supervisory stress tests and recently expanded its Z.1 Financial Accounts to track private credit intermediation more transparently.
Why does record hedge fund leverage in U.S. Treasuries affect Bitcoin and Ethereum liquidity?
Multi-strategy hedge funds are dominant liquidity providers in both U.S. Treasury cash-futures basis trades and institutional CME crypto basis and spot ETF arbitrage. If rising rate volatility triggers higher repo haircuts or margin calls on their $13 trillion gross asset footprint, portfolio-wide VaR cuts force simultaneous unwinding of crypto arbitrage books and spot ETF holdings.
Disclaimer and Risk Warning
This article is provided strictly for informational and educational purposes based on publicly available on-chain metrics and macroeconomic data. Nothing in this publication constitutes financial, investment, legal, or tax advice, nor should it be construed as a solicitation, recommendation, or offer to buy or sell any digital asset or financial instrument. Digital assets are subject to high market risk and extreme price volatility, and you may lose part or all of your invested capital. Historical market cycles and past performance referenced herein do not guarantee future results. You are solely responsible for your own investment decisions and should conduct independent research and consult a qualified financial advisor before making any financial commitments.