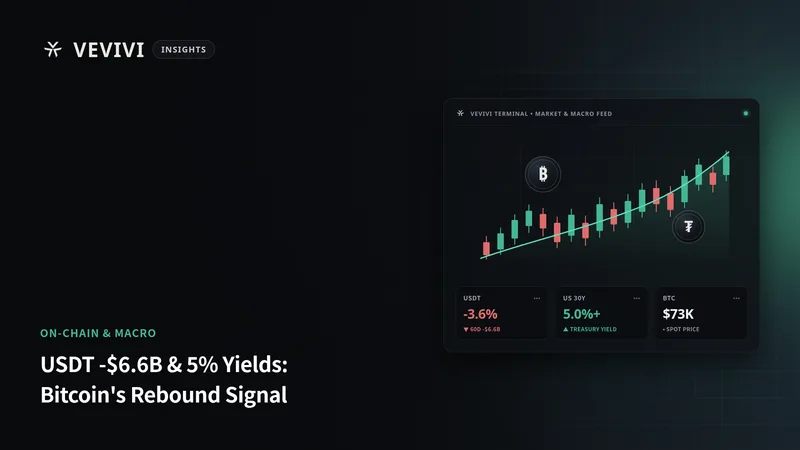
Bitcoin continues to trade under heavy pressure near the $73,000 level, down more than 40% from its all-time high above $126,000 set last October. With the market's Fear & Greed Index firmly stuck in fear territory, a striking figure from a recent CryptoQuant report has further rattled investor sentiment. Over the 60 days through November 7, Tether's (USDT) market capitalization contracted by $6.6 billion—a faster pace of dollar contraction than the one recorded immediately after the collapse of FTX.
Within the crypto ecosystem, dollar-pegged stablecoins such as Tether (USDT) and Circle's USDC function much like cash sidelined in brokerage accounts—dry powder waiting on exchanges to buy Bitcoin and altcoins. Naturally, expanding stablecoin supply is widely read as fresh buying power entering the market, while shrinking supply is interpreted as capital heading for the exits. As narratives spread that the market's buying power is evaporating, fears of a prolonged liquidity drought have intensified.
Yet focusing on headline dollar figures alone obscures what is actually happening beneath the surface. Once we examine the contraction in percentage terms relative to total market size, break down outflows by blockchain network, trace the cold yield math driving institutional allocations under elevated U.S. Treasury rates, and review how past rate-peak cycles unfolded, a very different picture emerges. Rather than signaling a structural collapse in crypto demand, current outflows reflect a rational rotation driven by interest-rate opportunity cost.
The Illusion of Double the Post-FTX Outflow and How Stablecoin Redemptions Actually Work
Several media outlets framed the latest USDT contraction as roughly double the post-FTX exodus, a comparison that ignores how dramatically the market has grown since then. In late 2022 following the FTX collapse, USDT's market cap shrank by roughly $3.2 billion over two months; compared strictly in raw dollar terms, the recent $6.6 billion decline is indeed more than twice as large. What that headline omits, however, is that Tether's circulating supply now stands near $184 billion—vastly larger than it was four years ago.
Measured as a share of total market cap, the comparison flips completely. The $3.2 billion redeemed after FTX represented a 5.0% contraction of Tether's supply at the time, whereas today's $6.6 billion drop represents just 3.6% of a much larger base. In proportional terms, the post-FTX shock hit liquidity far harder. Expanding the lens to the entire stablecoin sector tells the same story: total stablecoin supply is down roughly 7% from this year's peak, a modest pullback compared with the brutal 35% contraction suffered during the 2022–2023 bear market. Investors are not fleeing a broken market in panic; rather, they simply have far less incentive to hold idle cash in stablecoin form right now.
Understanding how stablecoins are minted and burned also clears up a common misconception. When retail traders sell Bitcoin on an exchange and move into cash, stablecoins do not vanish from circulation—those tokens simply change hands and remain in exchange wallets or with market makers. Actual supply contraction happens only when approved institutional counterparties send stablecoins back to the issuer to redeem underlying bank dollars, triggering token burns. Even for vetted individuals, Tether requires a minimum threshold of $100,000 to process direct redemptions. Moreover, large-scale institutional redemptions are a routine part of daily capital turnover. Circle, the issuer of USDC, processed more than $70 billion in redemptions during the first quarter of this year alone—nearly 90% of its circulating supply at the time. Minting and burning occur continuously, and recent weeks have simply tilted toward net redemptions.
Dissecting On-Chain Flows: Ethereum DeFi Outflows vs. Post-Hack Stabilization at Binance
Where exactly did the redeemed stablecoin supply come from? A chain-by-chain breakdown over the past 30 days shows that more than 70% of the total contraction originated on a single network: Ethereum. Ethereum hosts major institutional wallets, large exchange reserves, and DeFi protocols where capital chases lending and staking yields. That DeFi ecosystem had already suffered a severe blow on April 18, when the Kelp DAO bridge exploit triggered market freezes and billions of dollars in liquidity outflows on Aave, the sector's largest lending protocol. Stablecoin supply on Ethereum has fallen by more than 18% since that April shock, as shaken confidence in DeFi yields collided with rising Treasury rates.
By contrast, USDT supply on the Tron network has remained virtually intact. Tron-based USDT serves largely as everyday digital dollars across Asia, Latin America, and Africa—used for cross-border remittances, merchant settlements, and even payroll rather than speculative trading. Payment metrics underscore this divergence: from January through September of this year, global stablecoin payment volume climbed 45% year-over-year while transaction counts jumped more than 70%. Even as total balances dipped slightly, velocity in real-world commerce accelerated. What left the market was idle capital parked for crypto trading and DeFi yield farming, not real-economy adoption.
A major short-term catalyst that accelerated recent redemptions was the historic $6.3 billion hack at Binance on October 29, attributed by U.S. authorities to North Korea-linked threat actors. After Binance suspended withdrawals for roughly 56 hours and began reopening them in phases on November 1, CryptoQuant data showed more than $3 billion in USDT leaving the exchange within two days—matching the exact start of the sharpest consecutive dip in overall stablecoin supply.
Look closer at the timeline, however, and weekly stablecoin flows had already turned negative three weeks before the breach, while Binance's USDT reserves were already sitting near multi-year lows. Notably, the capital withdrawn from Binance did not migrate to rival exchanges, suggesting sidelined funds found no clear alternative venue and are likely to return once conditions stabilize. During the $1.5 billion Bybit hack in February last year, more than half of the exchange's USDT reserves exited within three days, only to recover fully within a month. Although media coverage largely stopped at the initial outflow headlines, Binance replenished 98% of the affected assets from its own reserves without external borrowing by November 3—the exact date daily deposits began outpacing withdrawals again. The hack briefly amplified an existing trend, but on-chain flows have already shifted toward stabilization.
The Root Cause of Capital Flight: 5% Treasury Yields and Unwinding Institutional Basis Trades
The deeper force draining liquidity long before the Binance incident comes down to interest rates. Earlier this year, military escalation involving Iran and disruptions around the Strait of Hormuz stoked oil and inflation pressures just as massive capital spending on AI data centers drove borrowing demand higher. As a result, the 30-year U.S. Treasury yield broke above 5% for the first time since 2007, while the 10-year yield continues to hover right near the 5% mark. Hopes that the Trump administration might pivot toward de-escalation after November's midterm elections faded quickly amid hawkish personnel signals in Washington and the failed impeachment bid against Defense Secretary Pete Hegseth on November 10, reinforcing expectations that elevated rates will persist.
At these levels, cold arithmetic takes over. With the Federal Reserve's target rate sitting at 3.75% to 4.00%, investors can earn roughly 4% practically risk-free in short-term U.S. Treasury bills, whereas holding USDT or USDC pays 0%. Issuers invest customer dollars into Treasuries and pocket the yield, while U.S. regulations bar payment stablecoin issuers from passing interest directly to token holders. Simply sitting in idle stablecoins now carries an explicit 4% annual opportunity cost.
Capital flows across yield-bearing tokens confirm how decisive that rate gap has become. Sky's dollar stablecoin (USDS), which previously attracted deposits with savings rates of 5% to 6.5%, saw sharp redemptions once its Sky Savings Rate dropped to around 3.6%—below risk-free Treasury bills. A revenue-sharing stablecoin backed by a Paxos-led consortium shrank by more than 10% in a month, and even growing challengers such as Ripple's RLUSD and Ethena's synthetic dollar face headwinds now that Ethena's futures funding yield has compressed to roughly 2% annualized. While some critics argue the crypto industry stalled the U.S. CLARITY Act by refusing to concede on stablecoin yield restrictions, surrendering yield capabilities altogether would reduce crypto platforms to little more than back-end distribution arms for commercial banks rather than letting market rate cycles naturally draw liquidity back.
The exact same math explains recent outflows from U.S. spot Bitcoin ETFs. Roughly $1.3 billion exited spot Bitcoin ETFs in early November, wiping out virtually all cumulative net inflows recorded earlier this year. Rather than signaling an institutional exodus from Bitcoin's long-term thesis, an analysis of SEC 13F filings from September last year through June this year by Galaxy Research revealed that reductions by nine heavyweight Wall Street institutions—including Goldman Sachs, cutting roughly 68,000 BTC—stemmed primarily from unwinding cash-and-carry basis trades. In a basis trade, institutions buy spot ETF shares while simultaneously shorting an equal amount of Bitcoin futures to capture the spread risk-free. Once futures premiums compressed to levels barely matching Treasury yields, net returns vanished after fees, prompting funds to close both legs and park cash in Treasuries. Because this capital left over pure yield arithmetic rather than broken fundamentals, it stands ready to return as soon as rate and spread dynamics flip.
Diverging Fortunes Across the Stablecoin Landscape
Ironically, a shrinking stablecoin supply under high interest rates has produced stark winners and losers across the sector. The biggest beneficiary is Tether itself. Powered by elevated Treasury yields, Tether generated $1.5 billion in net operating profit in the third quarter alone, nearly doubling its excess reserve cushion to $7.95 billion within three months. Its direct and indirect holdings of U.S. Treasury bills reached $132.4 billion—a sovereign-scale stockpile rivaling the total U.S. debt holdings of major economies such as South Korea. That scale explains why U.S. authorities, despite frequent regulatory scrutiny, have limited room to force a sudden unwind: any shock that triggers mass USDT redemptions would force Tether to liquidate tens of billions in Treasuries, rattling the U.S. bond market itself. Tether has effectively become too big to fail.
Traditional banks are the other quiet winners of the current lull, gaining valuable breathing room against deposit flight while building their own digital dollar rails. On September 1, a consortium of 21 major financial institutions—including Goldman Sachs, Bank of America, Citi, and Wells Fargo—formally agreed to launch a jointly issued dollar stablecoin targeted for the first half of next year alongside tokenized bank deposits.
By contrast, U.S.-listed issuer Circle has felt direct margin pressure. Unlike offshore Tether, Circle must pay substantial distribution revenue shares to partners such as Coinbase. Although Circle's third-quarter results released on November 4 showed higher headline revenue thanks to $182 million recognized from institutional presales of the ARC token for its proprietary Layer-1 Arc network, core reserve income slipped 8% year-over-year, weighing on its share price once investors stripped out the one-off token boost. Meanwhile, World Liberty Financial's USD1 stablecoin—closely linked to the Trump family—saw its market cap shrink by more than 20% recently as Democrats swept both the Senate and the House in the midterm elections and signaled aggressive congressional investigations, prompting politically sensitive holders to redeem.
Two Historical Rebound Rules and the Year-End Macro Crossroads
When, then, does liquidity rotate back into crypto? Federal Reserve Chair Kevin Warsh, who took office on May 22, presided over a unanimous rate hike in September and has maintained a hawkish stance emphasizing balance-sheet discipline. Many observers view this posture as an early effort to cement central-bank independence and dispel perceptions of White House alignment—meaning Warsh could also pivot swiftly once disinflation is clearly established. With Treasury buybacks merely recycling existing liquidity rather than injecting fresh money, the Fed's trajectory remains decisive, and past cycles highlight two clear rules.
First, institutional capital moves not when the Fed actually cuts rates, but as soon as the terminal rate—the ceiling of the hiking cycle—comes into view. After the Fed paused its hiking cycle in December 2018 and held steady for seven months before cutting in July 2019, Tether's supply more than doubled before the first rate cut even arrived. Likewise, after the Fed's final hike in July 2023, stablecoin supply began surging in mid-October, well ahead of policy easing. What sidelines big money is uncertainty over how high rates might climb; once the ceiling is set, institutions price in the peak and front-run the turn.
Second, stablecoin supply growth is a lagging indicator of price bottoms, not a leading one. During the last cycle, Bitcoin's price bottomed in November 2022, nearly a full year before stablecoin supply turned decisively higher in October 2023. Liquidity follows price recovery rather than preceding it. We saw the exact same sequence twice this year: in February, widespread forecasts warning that stablecoin liquidity would take at least six months to recover coincided with the exact bottom, followed by $8 billion in inflows within three weeks and new supply highs by May despite unchanged rates. Again in August, Bitcoin rallied from the $60,000s into the $70,000s first, pulling more than $9 billion in fresh stablecoin issuance in behind it.
That makes three upcoming macro dates critical for gauging whether a rate ceiling is forming: the October U.S. Producer Price Index (PPI) release on November 13, the release of FOMC meeting minutes on November 18, and the final FOMC policy meeting of the year on December 8–9. Markets have already priced in a December hike; the real debate pits warnings of further tightening early next year after firm consumer inflation against New York Fed President John Williams's earlier view that one final hike this year would leave policy restrictive enough to hold in 2027. Any signal in the PPI print or Fed minutes reinforcing a December rate peak could prompt sidelined capital to move ahead of the crowd.
While a broad expansion in total stablecoin supply likely awaits the first half of next year, Bitcoin has historically moved well ahead of that curve. Subtle on-chain shifts—net deposit inflows returning to Binance since November 3, incremental growth in RLUSD and Ethena supply, and whales withdrawing Bitcoin from exchanges into self-custody rather than positioning to sell—are already emerging beneath the gloom. Just as the night is darkest right before dawn, moments when market expectations hit rock bottom call for tracking disinflation and terminal-rate signals calmly rather than capitulating to headline fear.
Disclaimer and Risk Warning
This article is provided strictly for informational and educational purposes based on publicly available on-chain metrics and macroeconomic data. Nothing in this publication constitutes financial, investment, legal, or tax advice, nor should it be construed as a solicitation, recommendation, or offer to buy or sell any digital asset or financial instrument. Digital assets are subject to high market risk and extreme price volatility, and you may lose part or all of your invested capital. Historical market cycles and past performance referenced herein do not guarantee future results. You are solely responsible for your own investment decisions and should conduct independent research and consult a qualified financial advisor before making any financial commitments.